A Frugal Technological Model for Leukemia Detection Using Digital Microscopy
Authors: Juan López Prieto, Miguel Purizaca, Jimmy Armas, Paola A. Gonzalez
Publication date: July 2019
0. Abstract
In this paper, we propose a low-cost technological model for optimizing the detection process of leukemia using digital microscopy. The model is targeted to be used in remote areas in developing countries where availability of resources is an issue. This model applies the canny algorithm on a bank of images of normal and abnormal microscopic cells. The proposed model includes the capture, digitization, and analysis of microscopic samples, Fives phases are included in this model: 1. Data collection; 2. Data capture; 3. Image processing; 4. Cell classification; 5. Display of results. The model was preliminary validated with five blood samples from three men and two women in different age categories. All these samples were validated by the Head of Clinical Pathology at a public hospital in Callao, Lima, Peru. The results showed that a 90.5% effectiveness rate of white blood cell identification was obtained. This results aims to provide an additional and accurate tool to detection of potential leukemia.
1. Introduction
Cancer is one of the major leading cause of death recently and has become a public health concern worldwide. According to (refs), one in six deaths is caused by this disease. Detection and treatment of cancer are often an economical concern for health instituions and government. In 2017, only 26% of lowincome countries reported that public health had pathology services to serve the general population whereas more than 90% of high-income countries provide treatment for patients with cancer. In Peru, statistics indicate that each year about 50.000 new cases of cancer are diagnosed, of which about 30.000 end in death. This is due to the fact that 75% of cancer cases in Peru are diagnosed in advanced stages and current treatments are often unable to cure the disease. Another area of public concern is the cases of cancer in children. In Peru, for instance, it is estimated that out of 1200 new cases of childhood cancer detected annually, 350 end in death. These estimates are constantly increasing due to the lack of economical and reliable solutions to detect cancer. In Peru, for instance, 60% of the neoplasms used to detect cancer are analyzed in advanced stages. Therefore, the process of cancer diagnosis in Peru takes almost three times more than in developed countries. A patient can take three months to develop the first symptoms until a diagnosis is achieved. This is in part due to the low educational and socioeconomic level of parents, the poor training of primary care physicians, delays in the patient referral system and lack of equipment to conduct the testing. Leukemia is the most common cancer in children and adolescents, accounting for nearly one in three cancers. About three out of four cases of leukemia in children and adolescents are of Acute Lymphocytic Leukemia (ALL), and most of the other cases are of Acute Myeloid Leukemia (AML).
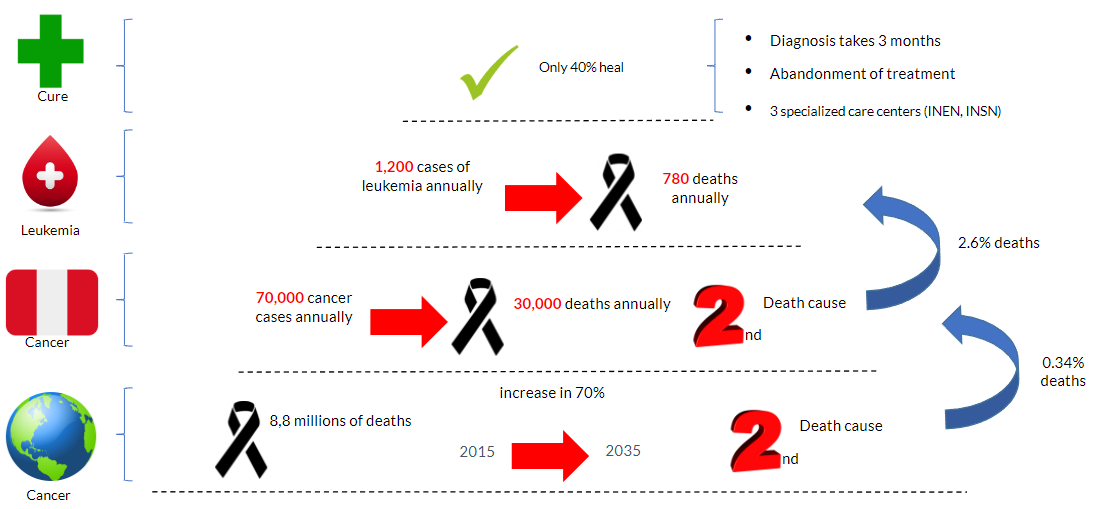
This paper proposes a technological model that digitizes or optimizes the current diagnostic process with low resources. This model is expected to serve as a tool for both the specialist medical staff and the primary care medical staff. For one hand, the model will provide specialists with more organized data to improve their process of diagnoses. On another hand, the model will help primary care medical staff improve their decision-making process in referral and prioritization of alarming cases. This paper is structured as follows: first, we will analyze some existing solutions regarding the detection of Leukemia, then we will describe the details of the proposed model, and finally we will give some conclusions and discuss the results obtained in our pilot scenario.
2. Literature Review
The identification of abnormal cells is a critical step in the process of diagnosing leukemia. This process is usually automated through the use of image processing techniques. Below, we briefly discuss some of the existing algorithms that help identifying such abnormal cells as well as the technologies that support this process of identification and classification of cells.
A. Cloud Platform Evaluation
The identification of abnormal cells is a critical step in the process of diagnosing leukemia. This process is usually automated through the use of image processing techniques. Below, we briefly discuss some of the existing algorithms that help identifying such abnormal cells as well as the technologies that support this process of identification and classification of cells.
For our proposed technological model, we decided to use Microsoft Azure, because of the University alliance agreement that our university has with them. In addition to accessing these services for free, this cloud platform offers high processing power and large memory.
B. Evaluation of microscope types for the capture of digital samples
Digital microscopes are the best tool to take digital images of peripheral blood samples. This equipment are just variations from the traditional microscopes. These microscopes use a camera connected to an LCD or a computer monitor
We opted for the Digital Microscope “LabSystem DM-55 with LCD” due to the higher quality in analyzing digital microscopic samples as well as for its lower cost.
C. Edge Detection Algoritms
Canny algorithm seems to be widely used in this field because has a lower percentage of false edge detection than the other algorithms. Although Canny rated high in computational complexity, we decided to use this algorithm in our proposed model as our cloud solution was able to handle high computing processing requirements
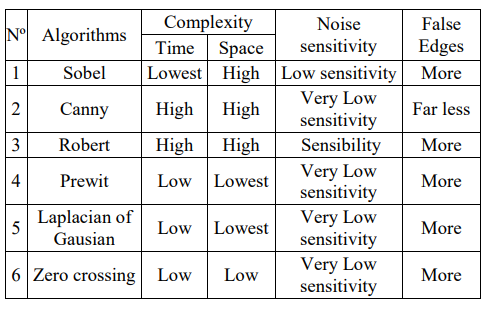
This image represent the canny algorithm process:

3. The Proposed Frugal Model For Leukemia
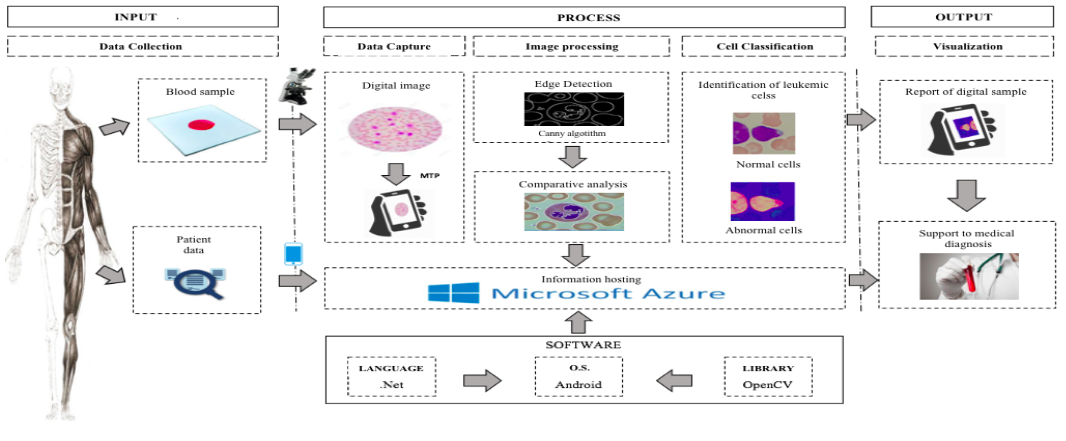
The model proposed in Figure 2 consists of five phases: data collection, data capture, image processing, cell classification, and display of results. Our model intends to cover all the steps in the process of leukemia (or another type cancer) detection. Each phase is explained below.
A. Data Colection
Two types of data are collected from the patient. The first one is the blood sample acquired through a complete blood count (CBC). The second one is the basic data of the patient: full name, age, and gender. This data is essential to complete the next phases because the microscopic image to be processed will be taken from the blood sample, and the date of the patient is needed to support medical diagnosis. Furthermore, this data can also be stored in a database and further analyzed and aggregated for medical research and health policy developments.
B. Data Capture
In this phase, the microscopic image product taken from the patient's blood sample is digitalized. The digitalization is done through a digital microscope that captures the image and sends it through the MTP to a computer, where it will be stored in an Azure SQL Database along with the patient information.
C. Data Processing
This phase has two parts. First, an edge detection analysis of the images of the cells to be processed is made through the Canny algorithm. Once the edges of those images are identified, a comparative analysis against the images of cell stored in Azure SQL Database will be held. This will allow the identification of the leukocytes.
D. Cell Classification
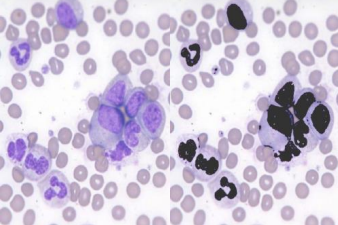
Once the comparative analysis of the images is done, the cells are classified into two groups starts: leukocytes and the rest of the blood cells. Only the leukocytes are painted in black to facilitate easy examination by a medical staff who will determine any anomalies in the sample.
E. Display of Results
In this phase, all the analyses from the previous phases are shown to the medical specialist who will diagnose the patient based on all the findings or, if needed, he or she will request more information in order to clarify and support the diagnosis. It should be noted that the objective of the model is not to diagnose, but to work as a technological tool that will provide the doctor with more information when giving a diagnosis of this sort.
- Percentage of effectiveness of identified white blood cells : This indicator helped us to verify the effectiveness of the algorithm.
- Number of red blood cells, platelets or any other identified object: This indicator helped us to define a margin of error of the model.
F. Display of Results
Canny algorithm seems to be widely used in this field because has a lower percentage of false edge detection than the other algorithms. Although Canny rated high in computational complexity, we decided to use this algorithm in our proposed model as our cloud solution was able to handle high computing processing requirements
4. Implementation
A. Data Colection
For the implementation of the proposed model, blood samples from patients were taken, as well as their demographic data. The blood samples were taken from the vein, located in the forearm. A drop was placed on a peripheral plate. Then it was combined with some dyes through the Wright Stain, which facilitates the differentiation of the types of blood cells, to be analyzed through the Digital Microscope. The data collected from the patient is: full name, ID, age, gender and date of birth.
B. Data Capture
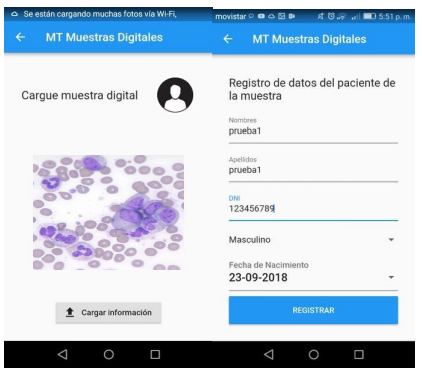
In this stage, the microscopic image of the blood samples gathered in the previous stage was digitized. By using the Digital Microscope “LabSystem DM-25”, the images are captured and sent to a computer in order to store them in the cloud. In this case, the images of the five microscopic samples analyzed were stored for its later processing. The loading of these images of the samples was done by the mobile application as shown in Figure.
C. Image Processing
For image processing, the five samples are processed in the mobile application,.The result of the processing is the identification and staining of black color of the white blood cells nuclei. This graphical distinction is intended to aim the medical staff in his/her analysis.
D. Cell Classification
Once the images are processed, the cells are classified into two: white blood cell nuclei and others. Table IV shows the number of nuclei of white blood cells identified by each sample analyzed:
E. Visualization
Once leukocytes nuclei have been classified, both the original image and the processed image are displayed in the mobile application, as well as the information collected from the patient.. Figure 4 shows the five different records of the samples studied in this validation.
- Percentage of effectiveness of identified white blood cells : This indicator helped us to verify the effectiveness of the algorithm.
- Number of red blood cells, platelets or any other identified object: This indicator helped us to define a margin of error of the model.
F. Display of Results
Based on the data collected, it is observed that the identification of the nuclei of the leukocytes is essential for a future diagnosis of any type of leukemia. The digital microscope is also crucial, because it is the tool that will allow us to take the images of the microscopic samples and digitize them for later analysis. For the validation of the model, the quantity of leukocytes identified by the specialist in hematology was compared to the quantity of leukocytes identified by the technological model through the mobile application. Based on this, the effectivity rate of each sample was calculated as shown:

5. Conclusions
We proposed a technological model for optimizing the detection process of leukemia using the Canny algorithm through digital microscopy. This model allows the identification of leukocytes based on a bank of images of microscopic cells, and the parameter established for the detection of cells (size and color). Also, the model was evaluated through all its components (PC, microscope and camera) resulting in $4,146, which is a low-cost compared to another solution such as the ThinPrep image processor that costs $44,480.
The model was tested at a public hospital in Callao, Lima, Peru. The validation results showed a 90.5% precision rate for the identification of leukocytes, and a 9.5% error rate. Both rates were calculated based on the quantity of leukocytes identified by a medical specialist in regard to the quantity of leukocytes identified by the proposed model. The medical staff pointed out that the model has the potential to significatly reduce the detection times of leukemia by 64%. This percentage was calculated based on the average time for Leukemia detection of the 3 leukemia samples of the experimentation, the average was 32 days, when actually, in Peru the average is 90 days. This proposed model is intended to be used at primary care centers usually located in zones of poverty of Peru, lacking personnel specialized in the analysis of these samples, infrastructure, and tools used for a proper diagnosis. Finally, the medical specialist validated the positive social and economic impact that such a model can have by contributing to Peru's development in terms of the use of technology in the health sector.